
Five takeaways from Coinbase’s S-1
Feb 25, 2021The Coinbase S-1 is out! And hot damn, did the company have a good fourth quarter.
TechCrunch has a first look at the company’s headline numbers. But in case you’ve been busy, the key things to understand are that Coinbase was an impressive company in 2019 with more than a half-billion in revenue and a modest net loss. In 2020, the company grew sharply to more than $1.2 billion in revenue, providing it with lots of net income.
The Exchange explores startups, markets and money. Read it every morning on Extra Crunch, or get The Exchange newsletter every Saturday.
The company’s Q4 2020 was about as big as its entire 2019 in revenue terms, albeit much more profitable because the sum was concentrated in a single quarter instead of spread out over four.
However, beyond the top-level numbers are a host of details to explore. I want to dig more deeply into Coinbase’s user numbers, its asset mix, its growing subscription incomes, its competitive landscape and who owns what in the company. At the end, we’ll riff on a chart that discusses the correlation between crypto assets and the stock market, just for fun.
Sound good? You can read along in the S-1 here if you want, and I will provide page numbers as we go.
Inside Coinbase’s direct listing
To make things simpler, we’ll frame our digging in the form of questions, starting with: How many users did Coinbase need to generate its huge 2020 revenue gains?
The answer: not as many as I expected. In 2019, Coinbase generated $533.7 million from what it describes as 1 million “Monthly Transacting Users” (page 14). That works out to $533.7 million in revenue per MTU for the year.
In 2020, Coinbase generated $1.28 billion in revenue off of 2.8 million MTUs, which works out to around $457 apiece during the year. That’s a bit lower, but not terribly so. And given that the company’s transaction margins ranged in the mid-80s percent during much of 2020, each Coinbase active trader was still quite valuable, even at a lower revenue point.
As we noted in our first look at the company’s economics, Coinbase’s metrics are highly variable. Its MTU figure is no exception. Observe the following chart from its S-1 filing (page 95):
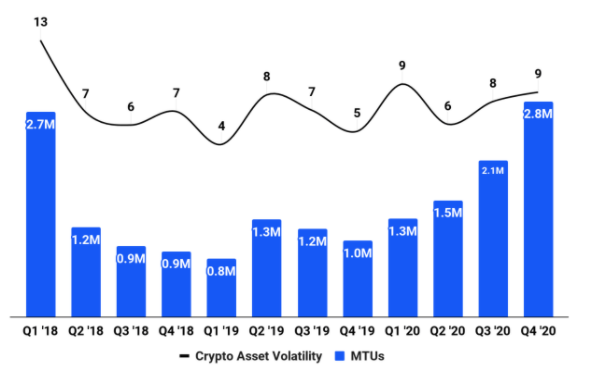
Coinbase’s Q1 2018 was nearly as popular in MTU terms as its final quarter of 2020. And from that point in time, the company’s MTUs fell 70 percent to its Q1 2019 nadir. That’s a lot of variance.
The company itself notes in its filing that “MTUs have historically been correlated with both the price of Bitcoin and Crypto Asset Volatility,” though the company does point out that it expects such correlations to diminish over time.
The answer to our question is that it only takes a few million MTUs for Coinbase to be a huge business. But the other side of that point is that Coinbase has shown twice in two years (2018, 2019) that the number of traders on its platform can decline.
What assets do Coinbase users hold? This is a question that I am sure many of you crypto enthusiasts have. But first, what does the Coinbase user asset base look like? Like this, historically (page 96):
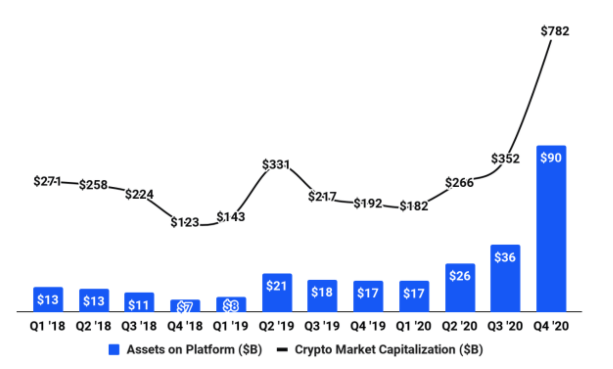
Holy shit, right? The chart shows two things. First, the rapid appreciation of cryptocurrencies overall, which you can spy in the upward kick of the black line. And then the blue bars show how the assets on Coinbase’s platform grew from $17 billion at the start of 2020 to $90 billion by year’s end.
,This morning I want to dig more deeply into Coinbase’s user numbers, its asset mix, its growing subscription incomes, its competitive landscape and who owns what in the company.